The Fast Track to Fixes: How to Turbo Charge Application Instrumentation & Root Cause Analysis
Causely
March 19, 2024

A key enabler for this is application instrumentation that facilitates an understanding of application services and how they interact with one another through distributed tracing. This is particularly important with complex microservices architectures running in containerized environments like Kubernetes, where manually instrumenting applications for observability can be a tedious and error-prone task.
This is where Odigos comes in.
In this article, we’ll share our experience working with the Odigos community to automate application instrumentation for cloud-native deployments in Kubernetes.
Thanks to Amir Blum for adding resources attributes to native OpenTelemetry instrumentation based on our collaboration. And I appreciate the community accepting my PR to allow easy deployment using a Helm chart in addition to using the CLI in your K8s cluster!
This collaboration enables customers to implement universal application instrumentation and automate root cause analysis process in just a matter of hours.
The Challenges of Instrumenting Applications to Support Distributed Tracing
Widespread application instrumentation remains a hurdle for many organizations. Traditional approaches rely on deploying vendor agents, often with complex licensing structures and significant deployment effort. This adds another layer of complexity to the already challenging task of instrumenting applications.
Because of the complexities and costs involved, many organizations struggle with making the business case for universal deployment, and are therefore very selective about which applications they choose to instrument.
While OpenTelemetry offers a step forward with auto-instrumentation, it doesn’t eliminate the burden entirely. Application teams still need to add library dependencies and deploy the code. In many situations this may meet resistance from product managers who prioritize development of functional requirements over operational benefits.
As applications grow more intricate, maintaining consistent instrumentation across a large codebase is a major challenge, and any gaps leave blind spots in an organization’s observability capabilities.
Odigos to the Rescue: Automating Application Instrumentation
Odigos offers a refreshing alternative. Their solution automates the process of instrumenting all applications running in Kubernetes clusters, with just a few Kubernetes API calls. This eliminates the need to call in applications developers to facilitate the process which may take time and also require approval from product managers. This not only saves development time and effort but also ensures consistent and comprehensive instrumentation across all applications.
Benefits of Using Odigos
Here’s how Odigos is helping Causely and its customers to streamline the process:
- Reduced development time: Automating instrumentation requires zero effort from development teams.
- Improved consistency: Odigos ensures consistent instrumentation across all applications, regardless of the developer or team working on them.
- Enhanced observability: Automatic instrumentation provides a more comprehensive view of application behavior.
- Simplified maintenance: With Odigos handling instrumentation, maintaining and updating is simple.
- Deeper insights into microservice communication: Odigos goes beyond HTTP interactions. It automatically instruments asynchronous communication through message queues, including producers and consumer flows.
- Database and cache visibility: Odigos doesn’t stop at message queues. It also instruments database interactions and caches, giving a holistic view of data flow within applications.
- Key performance metric capture: Odigos automatically instruments key performance metrics that can be consumed by any OpenTelemetry compliant backend application.
Using Distributed Tracing Data to Automate Root Cause Analysis
Causely consumes distributed tracing data along with observability data from Kubernetes, messaging platforms, databases and caches, whether they are self hosted or running in the cloud, for the following purposes:
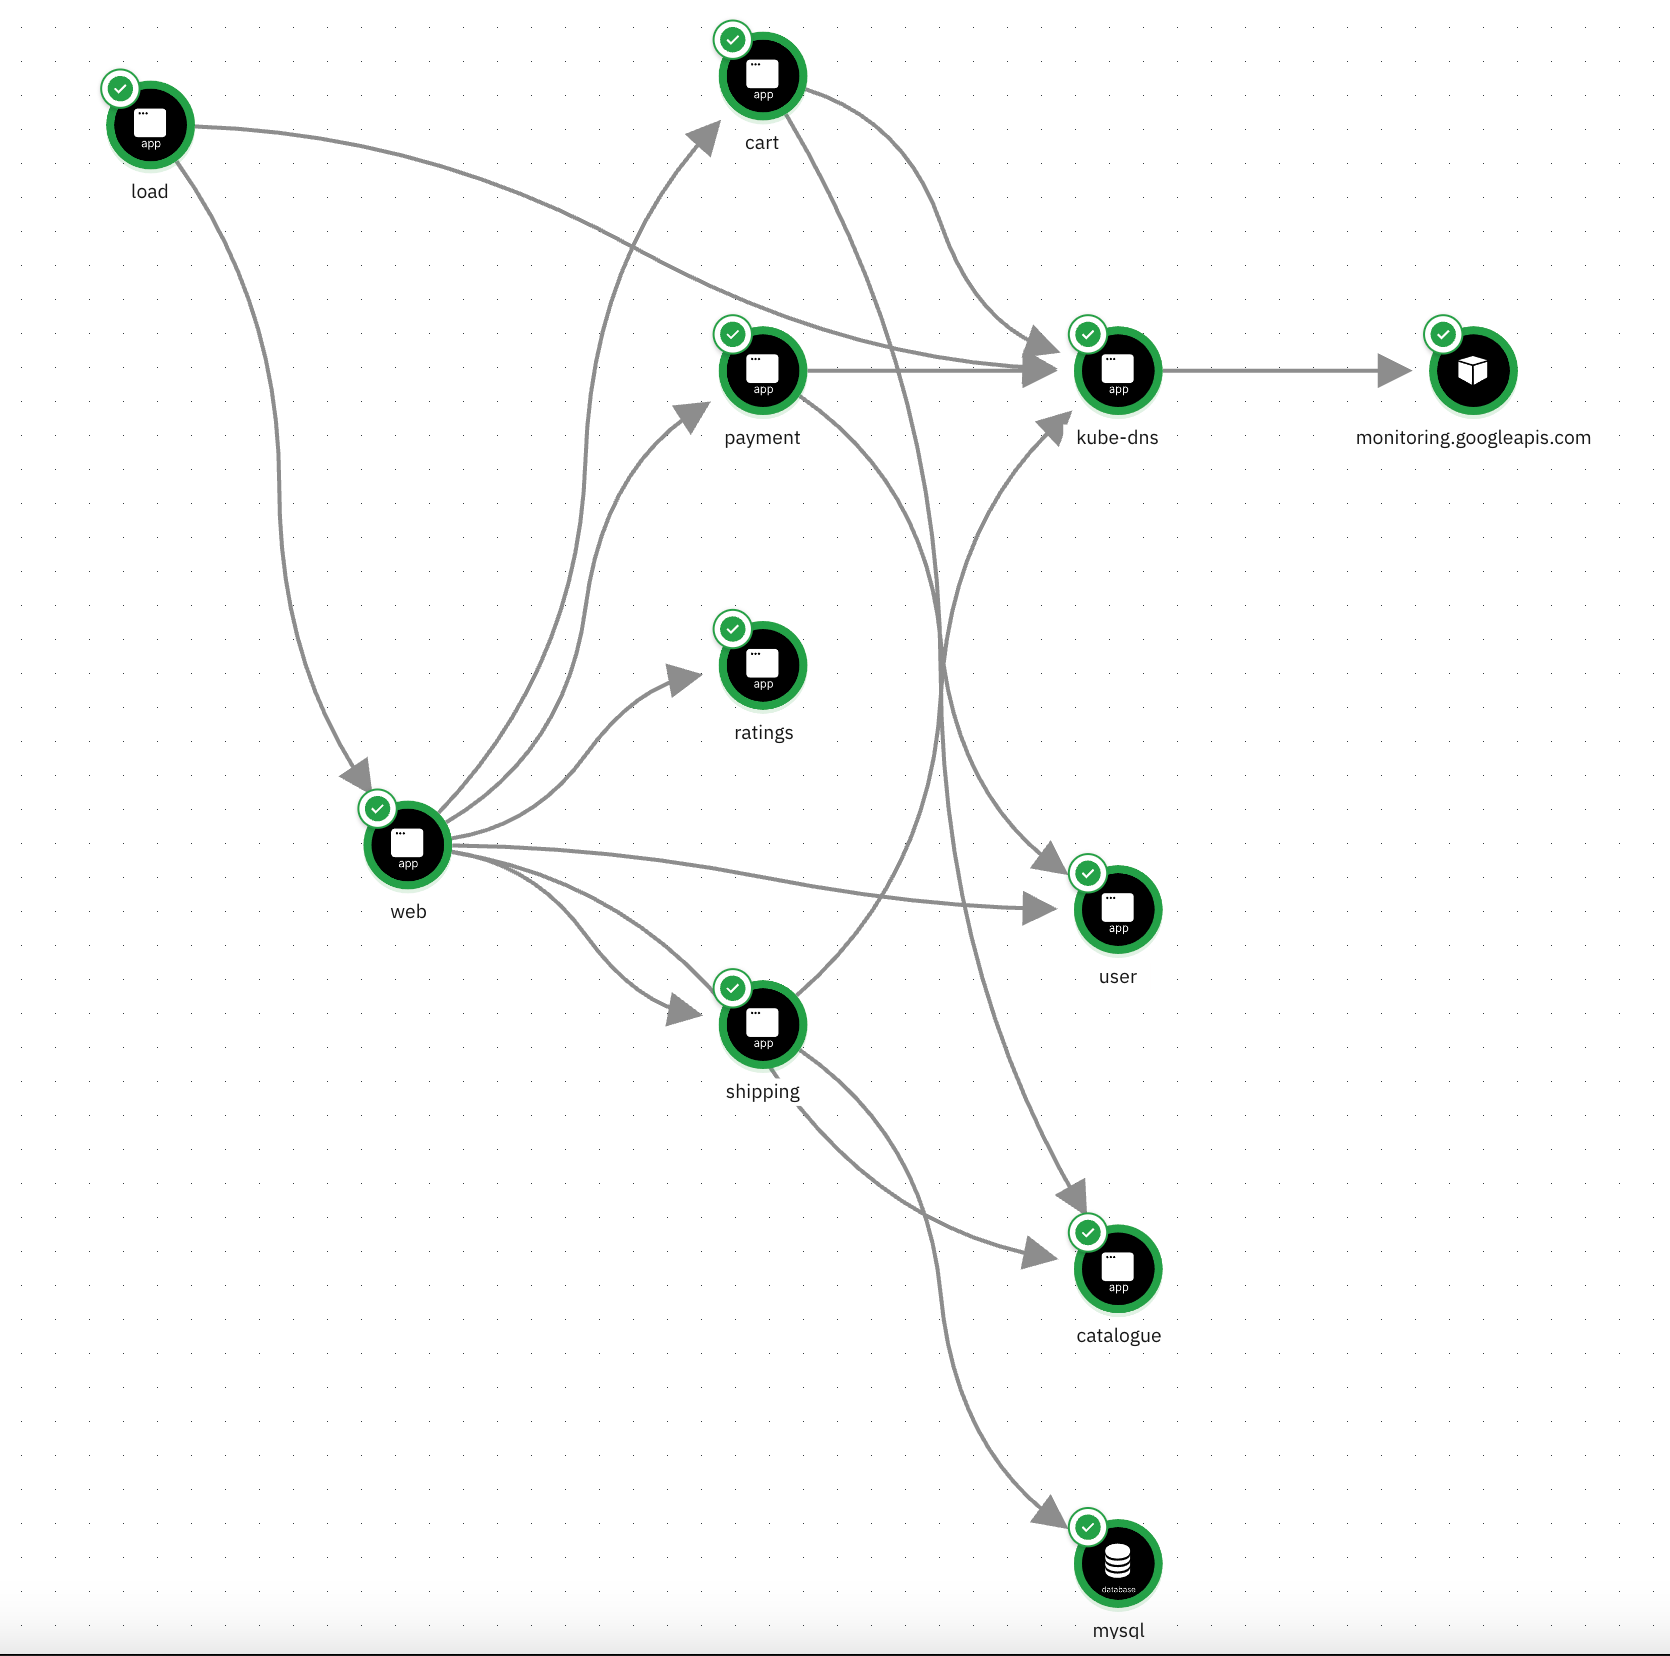
- Mapping application interactions for causal reasoning: Odigos’ tracing data empowers Causely to build a comprehensive dependency graph. This depicts how application services interact, including:
- Synchronous and asynchronous communication: Both direct calls and message queue interactions between services are captured.
- Database and cache dependencies: The graph shows how services rely on databases and caches for data access.
- Underlying infrastructure: The compute and messaging infrastructure that supports the application services is also captured.

This dependency graph can be visualized but also is crucial for Causely’s causal reasoning engine. By understanding the interconnectedness of services and infrastructure, Causely can pinpoint the root cause of issues more effectively.
- Precise state awareness: Causely only consumes the observability data needed to analyze the state of application and infrastructure entities for causal reasoning, ensuring efficient resource utilization.
- Automated root cause analysis: Through its causal reasoning capability Causely is able to automatically identify the detailed chain of cause and effect relationships between problems and their symptoms in real time, when performance degrades or malfunctions occur in applications and infrastructure. These can be visualized through causal graphs which clearly depict the relationships between root cause problems and the symptoms/impacts that they cause.
- Time travel: Causely provides the ability to go back in time so devops teams can retrospectively review root cause problems and the symptoms/impacts they caused in the past.
- Assess application resilience: Causely enables users to reason about what the effect would be if specific performance degradations or malfunctions were to occur in application services or infrastructure.
Conclusion
Working with Odigos has been a very smooth and efficient experience. They have enabled our customers to instrument their applications and exploit Causely’s causal reasoning engine within a matter of hours. In doing so they were able to:
- Instrument their entire application stack efficiently: Eliminating developer overheads and roadblocks without the need for costly proprietary agents.
- Assure continuous application reliability: Ensuring that KPIs, SLAs, SLOs and SLAs are continually met by proactively identifying and resolving issues.
- Improve operational efficiency: By minimizing the labor, data, and tooling costs with faster MTTx.
If you would like to learn more about our experience of working together, don’t hesitate to reach out to the teams at Odigos or Causely, or join us in contributing to the Odigos open source observability plane.
Related Resources
- Request a demo to experience automated root cause analysis with Causely first-hand
- Read the blog: Eating Our Own Dog Food: Causely’s Journey with OpenTelemetry & Causal AI
- Watch the video: Causely for asynchronous communication
- Join the Odigos community on Slack
